How to Debug Memory Crashes on Smart TV Apps
Reproduce smart-TV memory crashes, measure the right memory layers, isolate the owner and prove the fix with repeatable journeys and soak tests. Practical.

A smart-TV app that crashes after forty minutes rarely has one obvious "memory leak." JavaScript heap can grow, but so can DOM state, decoded images, GPU textures, video buffers and native player memory. Looking at one heap graph may leave the largest owner invisible.
The useful smart TV app memory crash method is mechanical: reproduce one journey, measure a memory slope, disable one owner, replay the same journey and soak the candidate fix. Keep model, firmware and build fixed while isolating the cause.
Make the crash repeatable
Write the shortest journey that causes growth: open detail, play, return, scroll several rails, switch profiles and repeat. Record cycle count and time to failure. If the crash appears only after backgrounding or an ad break, preserve that step rather than replacing the journey with synthetic allocation.
| Signal | What it may reveal | Common blind spot |
|---|---|---|
| JavaScript heap | Retained objects, listeners and caches | Native player and graphics memory |
| DOM or scene nodes | Detached or ever-growing UI trees | Decoded image size |
| Image and texture use | Oversized assets and unreleased surfaces | JavaScript references that recreate them |
| Video buffers | Player lifecycle and stream changes | UI-only profiler views |
| Process memory | Total pressure and operating-system kill risk | Which subsystem owns growth |
| Crash console | Stack, error and failure point | Slow growth before the final event |
Run the journey on the weakest supported device. A desktop browser can help inspect code, but its memory ceiling and garbage collector behavior don't reproduce a television.
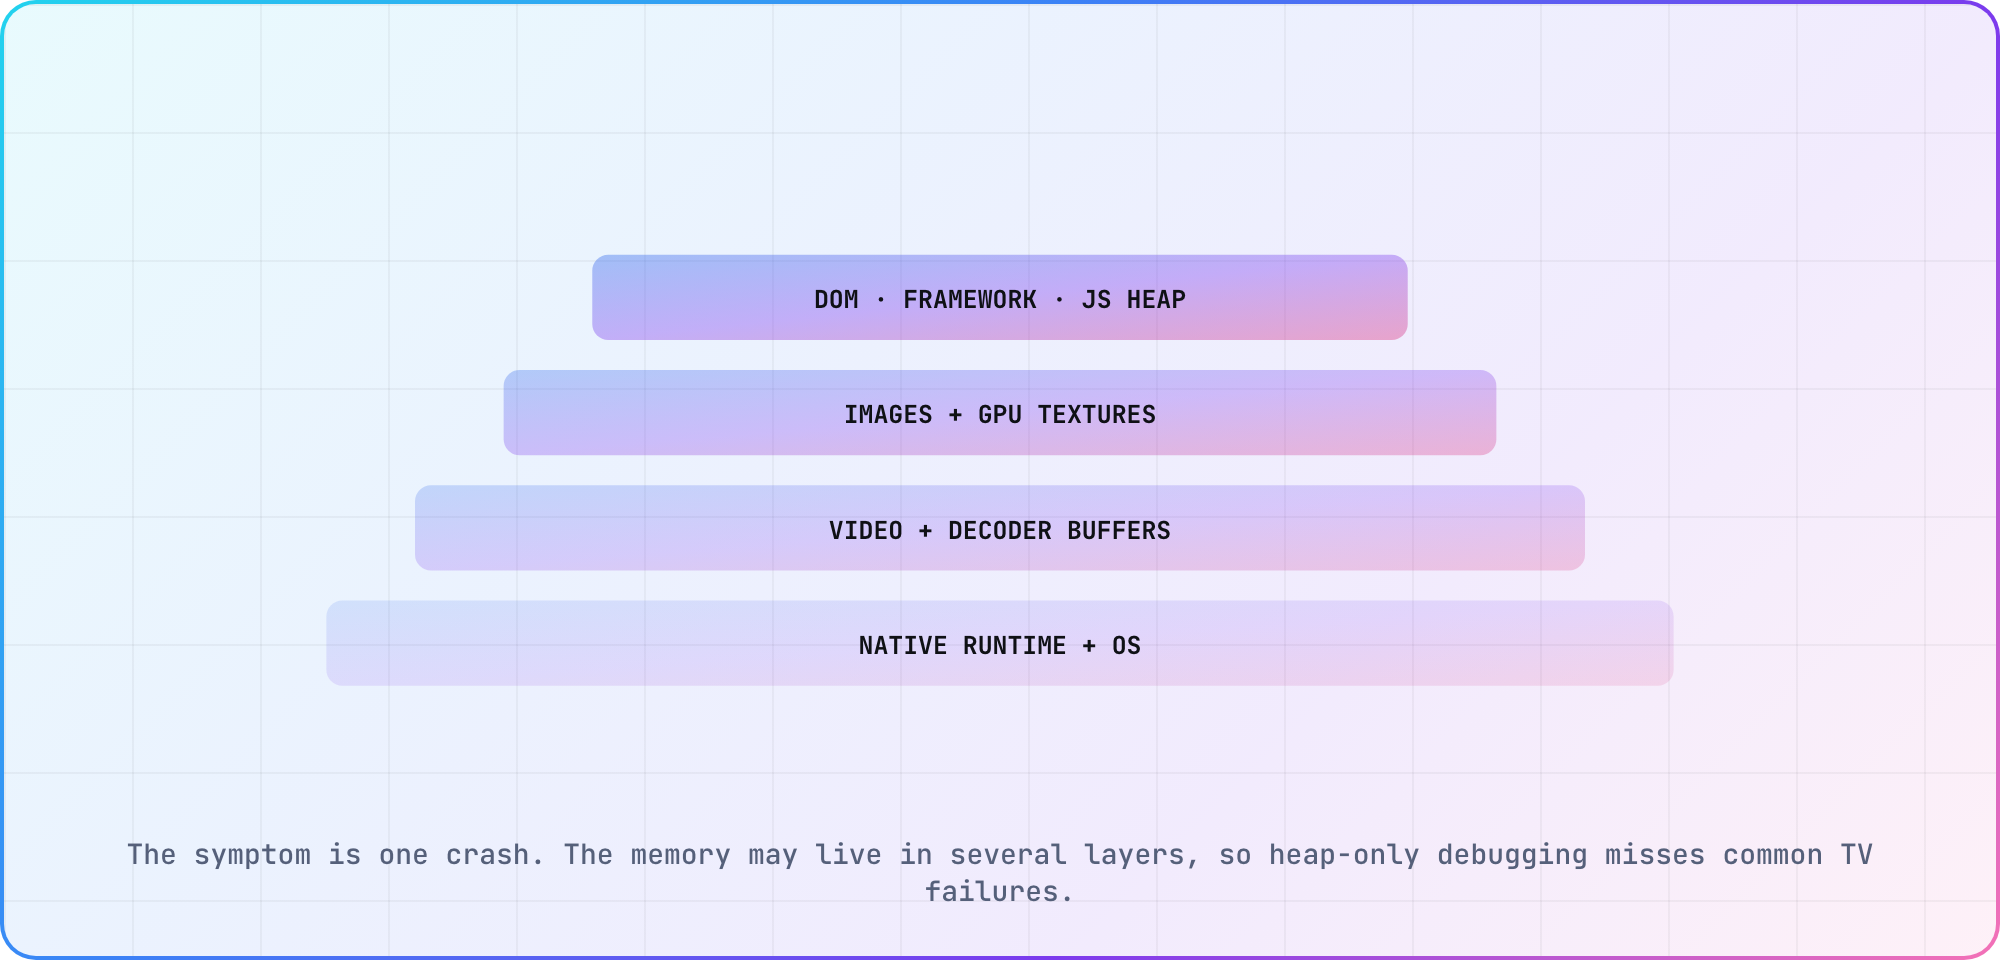
The symptom is one crash. The memory may live in several layers, so heap-only debugging misses common TV failures.
Measure more than the JavaScript heap
Samsung's TV memory guide separates JavaScript and garbage collection from images, graphics, DOM, media, data, canvas, WebGL and workers. Use that list as an ownership map even when the target platform differs.
Capture memory at app start, after content load and after every journey cycle. Note whether it rises steadily, reaches a plateau or spikes around playback. A plateau after cache warm-up may be healthy. A staircase that never returns after leaving a screen is a stronger retention signal.
On Android TV, include process memory and low-RAM behavior. Google's publishing checklist tells teams to profile memory and check "ActivityManager.isLowRamDevice()." Keep graphics and file-backed memory visible when the tooling exposes them.
Bisect by memory owner
Disable image prefetch, then replay. Replace real artwork with tiny placeholders, then replay. Stop video before leaving the player, remove the player instance, and replay. Cap caches, virtualize long rows, remove event listeners and terminate workers one change at a time.
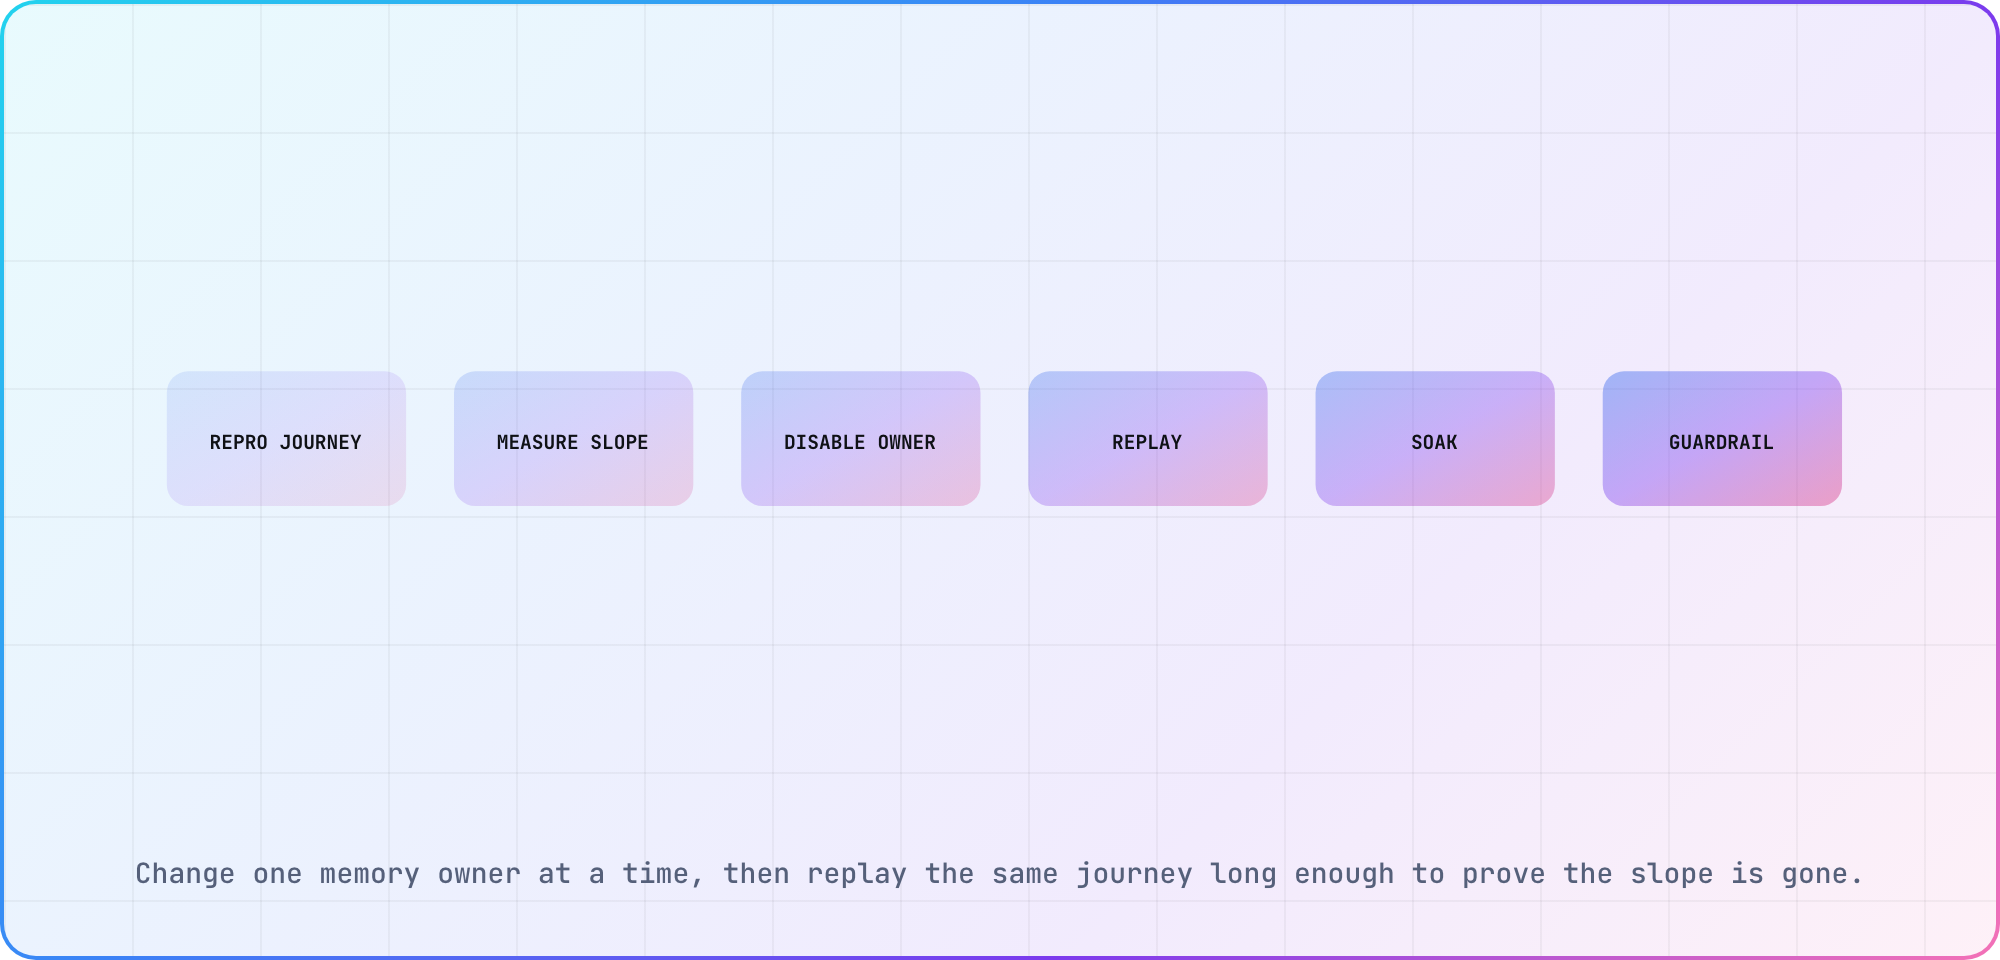
Change one memory owner at a time, then replay the same journey long enough to prove the slope is gone.
One-at-a-time changes are slower than deleting half the app, but they produce an explanation you can trust. If turning off artwork removes the slope, inspect image dimensions, decoded size, cache eviction and texture disposal. If only player teardown changes it, stay in the media lifecycle instead of rewriting the browse view.
Distinguish retention from temporary pressure
A leak retains memory that should become unreachable. Temporary pressure may come from legitimate high-water work: decoding a large image, switching streams or building a dense scene. Both can crash a low-memory television, but the fix differs. Retention needs lifecycle cleanup; pressure needs smaller assets, less concurrency or a narrower feature.
Force garbage collection only when the platform tool supports a diagnostic flow, and don't build the product around manual collection. The question is whether ordinary lifecycle behavior returns to a safe plateau.
Prove the fix on the failure cohort
Run the same journey past the old failure point, then extend it into a soak. Record the build, model, firmware, cycle count, start memory, plateau or final memory, and crash result. Repeat on a second device to make sure the fix didn't simply move work into another constrained layer.
For Roku failures, the platform's debugging console can provide crash line, stack and variable information. Pair that final output with the preceding memory and journey record. Use the TV platform reference to keep the evidence attached to the affected cohort.
Frequently asked
Why does my TV app crash when the desktop browser does not?
Televisions often have tighter memory limits, older engines and different graphics or media pipelines. A desktop may also collect memory differently and has more headroom. Use desktop tools to find suspects, then reproduce and measure on the weakest supported television before calling the defect fixed.
Is a growing JavaScript heap always a leak?
No. Caches and deferred garbage collection can grow before reaching a stable plateau. Repeat the same bounded journey and watch whether memory returns or levels off after cleanup. A staircase that keeps rising after the screen and its data should be gone is stronger leak evidence.
Can images cause a crash outside the JavaScript heap?
Yes. Compressed file size is much smaller than decoded pixel memory, and rendered images may also occupy graphics textures. Replace artwork with tiny placeholders during isolation. If the slope disappears, inspect dimensions, duplicate decoding, cache limits and disposal instead of focusing only on object counts.
How do I know whether the video player owns the memory?
Run the same journey with playback removed, then with explicit stop, listener cleanup and player destruction. Compare process and media-related memory where available. If the slope follows player creation or stream switches, reduce the case further and keep UI assets unchanged while investigating lifecycle behavior.
How long should a memory soak test run?
Run beyond the previous failure time or cycle count, then add enough margin to observe a stable plateau under realistic navigation and playback. There isn't one universal duration. Publish the journey, device, build and cycles so the result can be repeated after future player or framework changes.
What evidence proves a memory-crash fix?
Keep the original reproducible journey, before-and-after memory series, isolated code change, exact build, device, firmware and a run beyond the former failure point. Add crash-console output where available. A single successful launch or clean desktop profile doesn't prove the television retention path is gone.
Keep reading
Remote Smart TV Testing Without a Local Device Lab
Compare remote smart TV testing by exact hardware coverage, interaction depth, private-network access and evidence capture, then keep a small local smoke kit.
Samsung Tizen TV Test Automation: Limits and Workarounds
Automate Samsung TV build, signing, install and evidence capture while keeping device focus and playback verdicts outside unsupported official UI automation.